


Welcome to IntelliWork Weekly 1-1-1, where we equip purpose‑driven leaders with the management science that turns strategy into repeatable execution. In our last issue we looked at behavior‑based leadership habits. This week we raise the technical bar and examine how Hoshin Kanri—a rigorous Japanese policy‑deployment system—translates top‑level intent into quarterly and daily targets without losing sight of social‑impact ambitions.
1 – Insight
According to R.S. Kaplan & D.P. Norton in The Execution Premium Fewer than 10% of strategies are executed as originally planned because goals, metrics and resources aren’t cascaded with enough mathematical precision.”
This sobering insight from Kaplan and Norton underscores a hard truth: the real enemy of progress isn’t poor planning—it’s poor execution. Even the most brilliant strategies can falter when they fail to permeate an organization. Most plans die in the “middle management mush.” Spreadsheets track hundreds of KPIs, yet teams can’t see how their numbers influence the mission.
That’s where Hoshin Kanri‘ matrix (described below) becomes transformative. More than a planning tool, it’s a disciplined approach to aligning strategy with operations. It forces algorithmic alignment: every objective, target, and countermeasure is mapped, weighted, and reviewed in a closed-loop system that W. Edwards Deming referred to as “management by fact.” With Hoshin Kanri, strategy doesn’t just live in boardroom slides—it lives in daily work.
Most plans die in the “middle‑management mush.” Spreadsheets track hundreds of KPIs, yet teams can’t see how their numbers influence the mission—commercial or societal. Hoshin Kanri forces an algorithmic alignment: every objective, target, and counter‑measure is mapped, weighted and reviewed.
2 – Framework: Hoshin Kanri X‑Matrix
The Hoshin Kanri “X‑Matrix” is built around four tightly linked components that flow from vision today‑to‑day action.
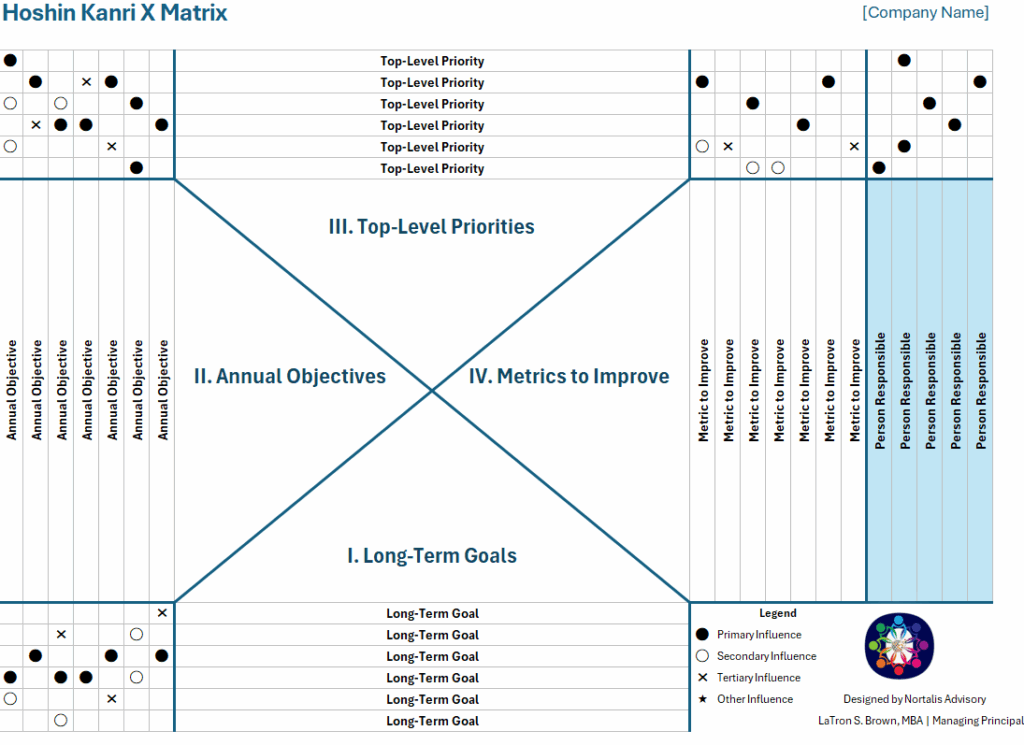
I. Long-Term Goals
Long‑term goals sit at the base of the diagram and define where the organization needs to be in three‑to‑five years. They capture breakthrough ambitions—market expansion, social‑impact milestones, or cost‑to‑serve reductions—that, if achieved, would fundamentally elevate the enterprise. When drafting this layer, leaders should ask, “If we met only three big goals over the next five years, which ones would change our trajectory or community impact the most?”
II. Annual Objectives
Moving clockwise, annual objectives translate those long‑range aspirations into concrete twelve‑month targets. They act as the yearly “slice” of the vision, forcing teams to decide which subset of the bigger journey must be tackled now. The core question here is, “What measurable changes must happen in the next fiscal year to prove we’re on course for the breakthrough?” Typical examples include launching a new product line, piloting a signature social program, or raising a critical funding threshold.
III. Top-Level Priorities
At the top of the X lie the improvement priorities—the high‑leverage initiatives, projects, or kaizen events that will physically move each annual objective. These are the action engines of the matrix. When selecting them, managers should ask, “Which projects, if executed flawlessly, will shift our annual metrics most decisively?” For a workforce‑development nonprofit, that might be “implement a competency‑tracking LMS,” “establish an employer advisory council,” or “pilot a green‑tech boot camp.” Each priority is assigned an owner, timeline, and often a lightweight project charter.
IV. Metrics to Improve
Finally, the right edge lists the metrics (KPIs) that prove whether the plan is working. They serve as the scoreboard, limited to the vital few indicators that directly speak to mission and margin. The question to settle here is, “Which numbers—if reviewed monthly—tell us unambiguously whether we’re succeeding?” These might include job‑placement rate, client‑satisfaction score, earned‑revenue dollars, or carbon‑emission intensity. Good metrics are objectively measurable, time‑bounded, and accepted by both leadership and frontline staff.
The small dots (or triangles) plotted at the intersections of the X‑Matrix act as a legend of linkage. Each dot signifies a causal relationship—for example, that a specific improvement project is expected to move a particular KPI, or that an annual objective directly feeds a long‑term objective. When the matrix is fully marked, leaders can see at a glance where strong connections exist and where gaps remain. If a KPI has no dots linking it to a project, the team must add a project or drop the metric; if a project lacks dots to any KPI, it should be re‑scoped or eliminated. In essence, the dot pattern becomes a visual test of strategic integrity, ensuring every action has a measurable purpose and every measure has a supporting action.
3 – Practical Application: Deploying a Technology Workforce Development Initiative
Stepping back into my old set of workforce development shoes, here is a practical application to develop a technology training workforce development initiative that benefits the community. Imagine an organization’s mission is to equip under‑resourced adults with skills that lead to family‑sustaining careers while helping local employers close talent gaps.
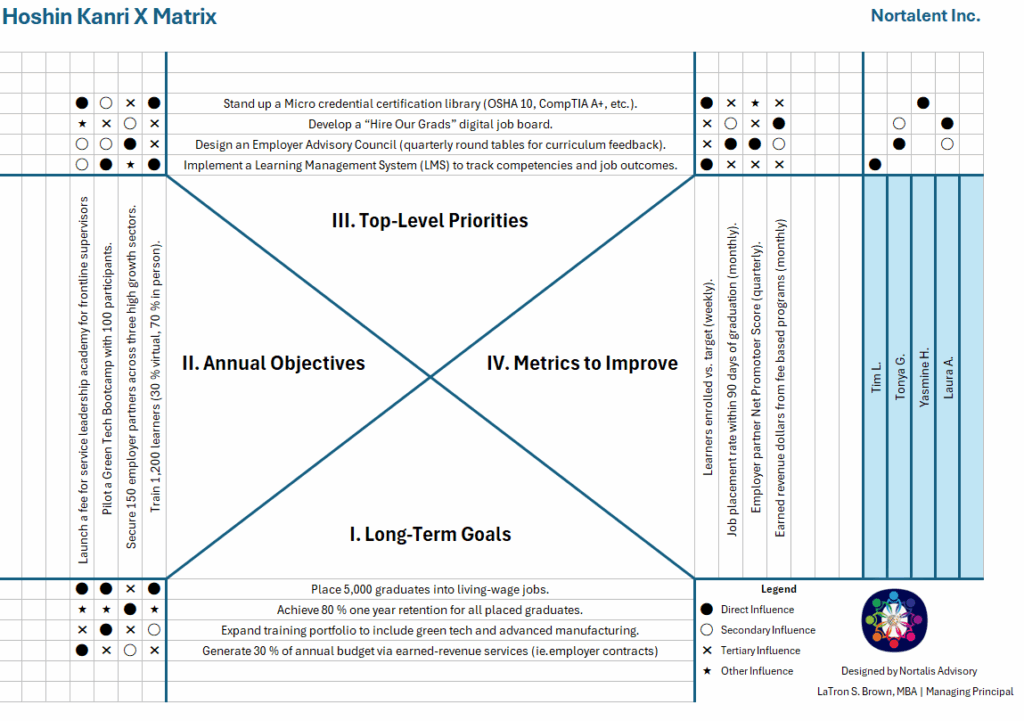
Hoshin Kanri aligns every initiative—training programs, employer outreach, grant proposals—onto one page.
I. Long‑Term Objectives (3‑ to 5‑Year Horizon) – The North Star outcomes that define success for the social enterprise and the community
- Place 5,000 graduates into living‑wage jobs.
- Achieve 80 % one‑year retention for all placed graduates.
- Expand training portfolio to include green‑tech and advanced manufacturing.
- Generate 30 % of annual budget via earned‑revenue services (e.g., employer upskilling contracts).
II. Annual Objectives (Current Fiscal Year) – Concrete 12‑month targets that slice off a measurable chunk of the long‑term objectives.
- Train 1,200 learners (30 % virtual, 70 % in‑person).
- Secure 150 employer partners across three high‑growth sectors.
- Pilot a Green‑Tech Bootcamp with 100 participants.
- Launch a fee‑for‑service leadership academy for frontline supervisors.
III. Top‑Level Improvement Priorities – High‑leverage projects or kaizen events that will directly move the annual objectives.
- Implement a Learning Management System (LMS) to track competencies and job outcomes.
- Design an Employer Advisory Council (quarterly round‑tables for curriculum feedback).
- Develop a “Hire Our Grads” digital job board.
- Stand up a Micro‑credential certification library (OSHA 10, CompTIA A+, etc.).
IV. Metrics / KPIs – The critical measures that prove initiatives are working. Each metric links back to one or more Annual Objectives.
- Learners enrolled vs. target (weekly).
- Job‑placement rate within 90 days of graduation (monthly).
- Employer‑partner NPS (Net Promoter Score (via quarterly survey).
- Earned‑revenue dollars from fee‑based programs (monthly).
V. Influences: How To See Relationships Among the 4 Categories.
Using the legend, one can see connections between each aspect of the model. In the legend I modified the commonly used “correlations” term to “Influences” to show direct impact , as well as indirect secondary and tertiary impact.
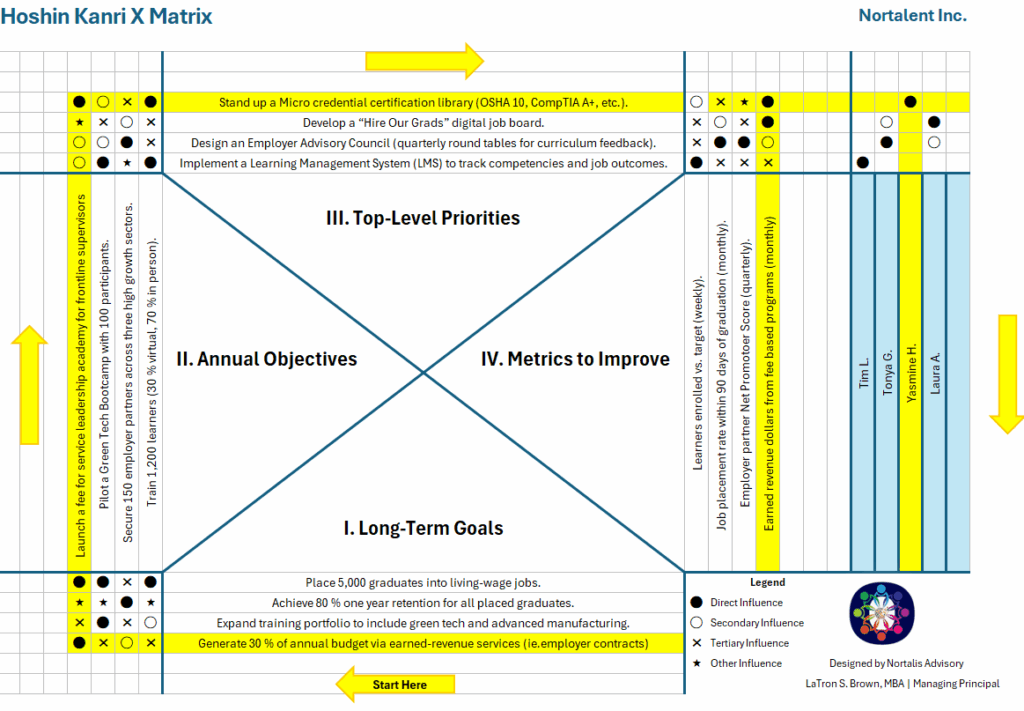
Here we see direct influences that make the fourth Long-Term Goal possible. In order to generate 30% of the revenues through direct service instead of grants. One would need to launch a training directed toward employers. You will need micro-credentials established for these employers, so their employees do not lose productivity during their training. Ultimately your KPI would be the earned revenue from the direct training.
They may be other influences; however, they may be indirect. The degree of influence should be discussed by the leadership team as well the executive sponsor who will ultimately be responsible for the success of the strategic initiative.
Why the X‑Matrix Is a Game‑Changer for Small Nonprofits and Social Enterprises
Many purpose‑driven organizations struggle to show donors a clear link between classroom activities and real‑life outcomes. By mapping every training module to specific KPIs—such as job‑retention rates or increases in graduate wages—the X‑Matrix creates an unmistakable line of sight from daily work to life‑changing impact. It also helps lean teams avoid spreading themselves thin on “nice‑to‑have” side projects; if an initiative can’t prove it will shift a metric tied to an annual objective, it’s automatically deprioritized.
Boards often wrestle with the tension between mission impact and financial sustainability. Because earned‑revenue projects (like fee‑based employer training) sit on the same matrix as mission metrics (such as placement goals), leaders can see trade‑offs in one view and allocate resources accordingly. Finally, when employers complain that curriculum lags industry needs, the X‑Matrix forces a solution: an Employer Advisory Council becomes a top‑level improvement priority formally linked to placement KPIs, making industry feedback a governance requirement rather than an afterthought.
In short, the X‑Matrix transforms scattered good intentions into a disciplined, data‑driven roadmap—one that satisfies donors, focuses staff, balances the budget, and keeps employer partners enthusiastically engaged.
I have created a handy dandy template for you to download and work through your own X-Matrix
Recommended Reading
“Hoshin Kanri for the Lean Enterprise” by Thomas L. Jackson A technical deep dive into policy deployment, complete with X‑Matrix templates, catchball scripts, and audit checklists.
Newsletter Sponsor
Check out monday.com! Ready to transform ensure you have well organized workflows for your organization’s goals? monday.com’s customizable dashboards provide real-time visibility into sales, volunteer hours, project status—any metric you need. Keep teams aligned by linking data insights to tasks, milestones, and OKRs, all in one place.
Book of the Month
Lean Enterprise: The Complete Step-by-Step Startup Guide to Building a Lean Business Using Six Sigma, Kanban & 5s Methodologies – Jeffrey Ries
This comprehensive guide walks you through multiple lean tools—Six Sigma, Kanban, 5S—to eliminate waste and streamline operations. It’s particularly useful for leaders looking to apply lean principles across departments, ensuring everyone is aligned on efficiency and impact.

Final Note
Complex goals need more than passion—they need management science. If this edition added a tool to your kit, please share it and tag #IntelliWorkDynamics.
Join the community → https://nortalconsulting.com/newsletter/

#HoshinKanri #XMatrix #PolicyDeployment #ManagementScience #LeanStrategy #Nortalis #IntelliWorkDynamics #LeveragingBusinessForGood